Asset characterization is an important step in determining the process performance capability of a given unit operations equipment. As we saw in an earlier post, it forms the backbone of process understanding and science-driven development/transfer. Lets recap things a bit here:
- asset characterization can be performed conveniently using computational/first-principles models.
- this results in a digital “nameplate” for the process asset under consideration, such as a crystallizer, a bioreactor, a tablet press or a granulator.
- Similar to a physical nameplate, the digital nameplate provides details on the capabilities of the asset or “process metrics” – in terms of expected mixing times, heat transfer capabilities, gas-liquid mass transfer effectiveness etc. – as a function of process conditions and material properties.
- relationships between process conditions/parameters (PPs) and process metrics (PMs) capture the geometry or scale-dependent aspects of a given unit process or unit operation
- When we consider only critical process parameters (CPP), critical material attributes (CMAs) and a critical set of process metrics (CPM) to characterize the performance capabilities of a process asset, we are in a position to draw on the quality-by-design (QbD) paradigm also.
Asset Characterization: The What …..
Staying with the CPPs, CMAs and CPMs, we have now established that asset characterization is a process by which CPPs & CMAs are related to CPMs for a given process asset (with a fixed geometric configuration). Lets also pause and recognize that CPPs and CMAs are typically measurable and/or controllable. So for instance, the gas flow rate in a bioreactor, the impeller speed in a crystallizer or the tablet loading in a pan coater are good examples of CPPs. CMAs are typically such things as physical properties of fluids (like the density, viscosity etc.) and bulk-solids (like tap-density, coeff. of friction etc.).
Like we noted earlier, CPMs are representative of the capabilities of a process equipment.
What exactly do we mean by a “capability” though?
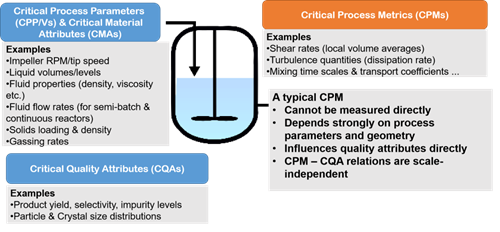
The capabilities of a process equipment are – in this context – related to the state of the internal environment of the equipment during the unit operation.
For instance, in a bioreactor, one capability that is of interest to the engineer is the extent to which effective mass transfer occurs between the gas bubbles and the liquid medium. In the same bioreactor, another capability of interest could be the rate at which feed introduced through a small inlet pipe mixes with the rest of the fluid. These capabilities, in a certain sense, establish how well or how poorly the equipment is able to create an environment that is conducive for the process in question. These capabilities can be evaluated using appropriate CPMs – which are not directly measurable but can be ascertained or estimated using theoretical methods. In the case of the bioreactor example that we have just discussed, the two capabilities that we considered give rise to two important CPMs – the effective mass transfer coefficient (kLa) and the mesomixing time scale.
It is typical for complex processes to have a few different CPMs, each of which characterizes one or more physical phenomena or process capabilities. The relationship between CPPs, CMAs and CPMs – as we will see below – is captured in a “Digital Nameplate” of the asset, which we dub its DNA.
Just as the DNA of a living organism holds all the information relevant to a living organism’s being, the DNA of the asset holds all the information relevant to its performance capabilities with respect to a specific unit operation.
Asset Characterization: The How …
Right – now that we have spent a good deal of time talking about the “What” of asset characterization, we can turn our attention to the “How”. Specifically, let us spend some time here looking at the steps by which the DNA of an asset can be established:
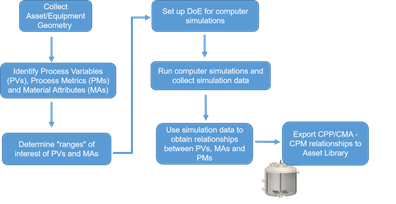
- Identify CPPs, CMAs and CPMs relevant to the asset. This step usually involves utilizing prior knowledge accumulated about the process and the asset. For the unit operation under consideration, a fairly comprehensive list of CPMs must be drawn taking all physical processes into account.
- Determine ranges of values for CPPs and CMAs. The next step is to determine the likely range of process and material conditions that the asset is likely to encounter.
- Create asset DNA for the relevant ranges. This step can be performed in more ways than one. The end-goal is to built a mathematical relationship between CPPs/CMAs and CPMs.
- If generic and widely applicable correlations are available to relate CPPs/CMAs with CPMs, then use these in the asset DNA
- In case such correlations are not available, use a combination of DoE, computational modeling and reduce-order model (ROM) generation to obtain the necessary DNA relationships for the asset. This does take a bit of doing – but is by far the most asset-specific way to generate the DNA.
- Store asset DNA information for later retrieval. A typical way to store DNA is to create an object-oriented database of all assets with the DNA relationships stored as object attributes.
Once the DNA of an asset is created, it is ready to be used for a number of purposes – the most natural amongst which is the creation of a “Process Signature” for a given unit operation.
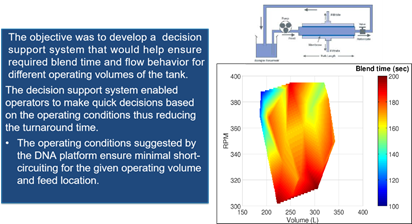
A simple real-life example of DNA using computational methods is shown in the adjoining figure. The bio-mixer equipment that was characterized in this example was part of a UF/DF setup. As we can see in the schematic, a relationship between the CPM of interest here (macromixing time) and two CPPs – liquid volume and impeller RPM – was developed using computational fluid dynamics (CFD) simulations. A reuseable ‘heatmap’ was created as a means to store the DNA. This heatmap is used today by engineers as a convenient tool in facility fit assessments for campaigns. DNA heatmaps like the one on this example can thus enable quality-driven risk-aware decision-making for technology transfer activities.
In the next blog article, we will look at ways in which a simple process signature can be compiled using process data (lab/pilot/manufacturing) and asset DNA.